What is the Buffett Indicator and how to use it?
With the continuous negative news about rising inflation and the Federal Reserve raising interest rates by another round, the market reacted violently. Many investors are very confused and they are wondering, will the market drop further from here? Or is it the best time to start buying to profit from the cheap?
In this time of confusion, it’s best to always consult the greatest investor of all time, Warren Buffett for advice. Because when it comes to investing, it’s all about risk control. If we can reduce our risk and take care of the downside, the upside will take care of itself.
That’s why today, I am going to share with you an investment indicator that can calculate the risk level of the market. In fact, this indicator was proposed by the greatest investor Warren Buffett himself, saying that it’s “probably the best single measure of where valuations stand at any given moment.”
And that is none other than the Buffett Indicator!
What is the Buffett Indicator?
The Buffett indicator is a valuation method used to assess how expensive or cheap the stock market is. Warren Buffett first proposed it in 2001, advising investors to look at the market valuation by dividing the total value of all publicly traded stocks in the US by the US GDP. The result of this calculation is the percentage of GDP that represents stock market value.
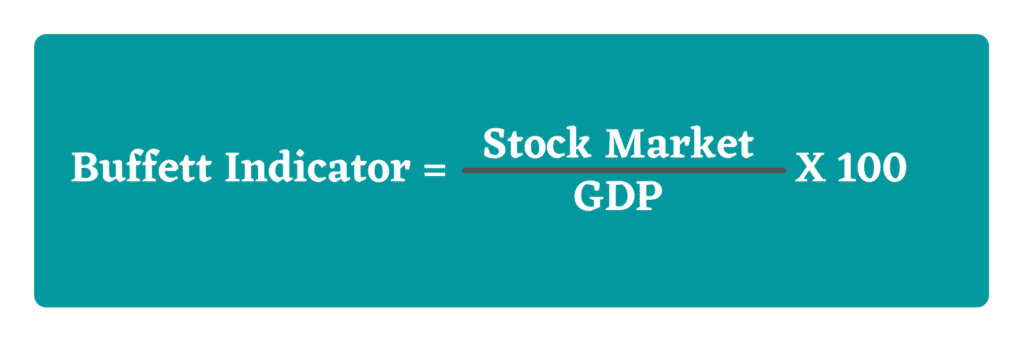
Typically, a result that is greater than 100% is said to show that the market is overvalued.
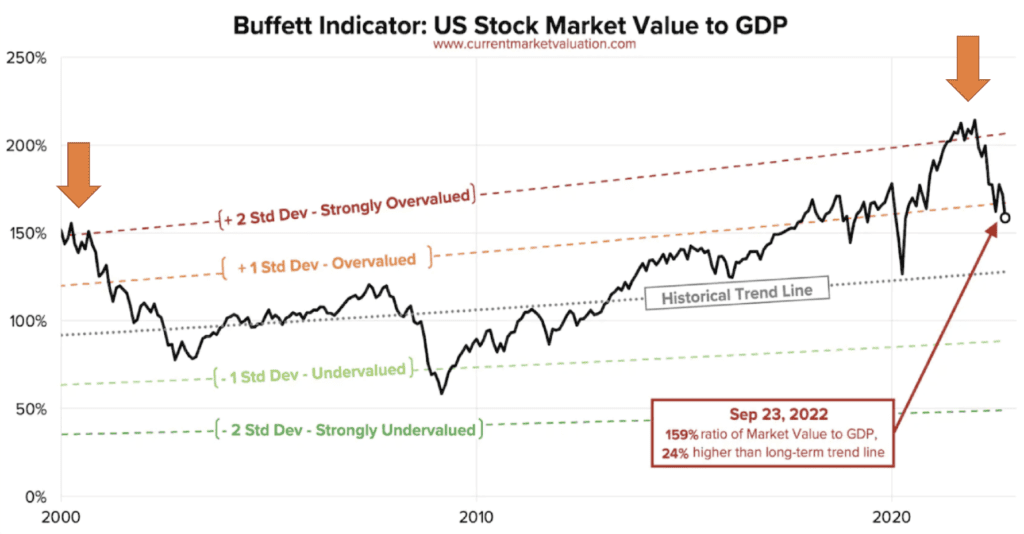
And Warren Buffett also once said: “If the percentage relationship falls to the 70% or 80% area, buying stocks is likely to work very well for you. If the ratio approaches 200% — as it did in 1999 and a part of 2000 – you are playing with fire.”
And indeed, the Buffett indicator successfully predicted the crash in the 2000 dot-com bubble, as well as the most recent stock market crash, where the indicator exceeded over 200%. What happened afterward, is exactly what we are experiencing right now, stock crashing down and down, and there seems to be no end to the bottom.
But before you get too pessimistic, let’s look at the bright side!
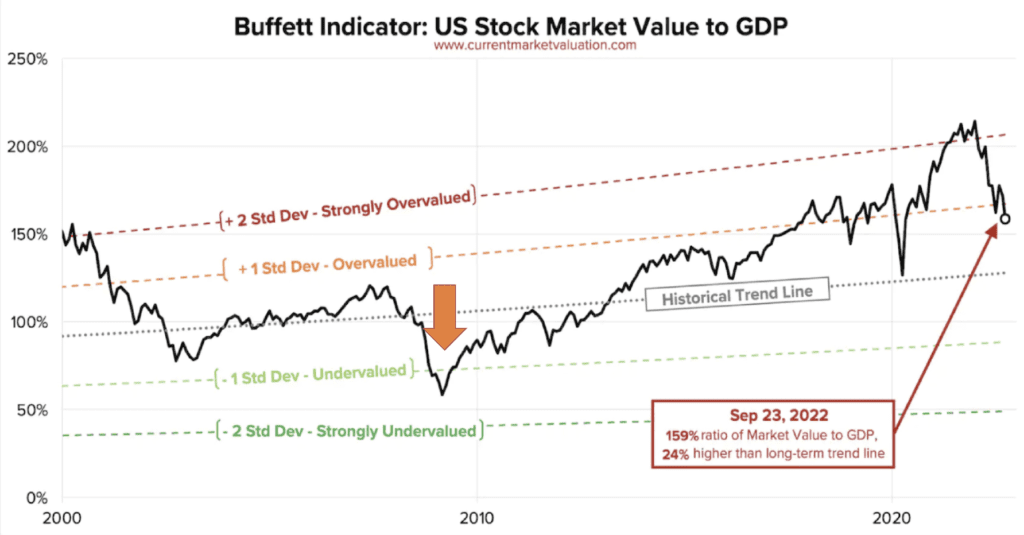
You can also use this indicator to start buying when the market is cheap!
As you can see, the best time to buy is when it drops to about 50%, because that is when the stocks are undervalued. Back then in the 2008 financial crisis, the market dropped to an all-time low, sending the indicator to close to 50%. If you started investing back then, your return could easily be 400% just by buying S&P500.
Buffett Indicator Today
So the question is, what is the percentage right now in this market condition?
With all these drops, have we reached a low-risk level?
The answer is… 151%!
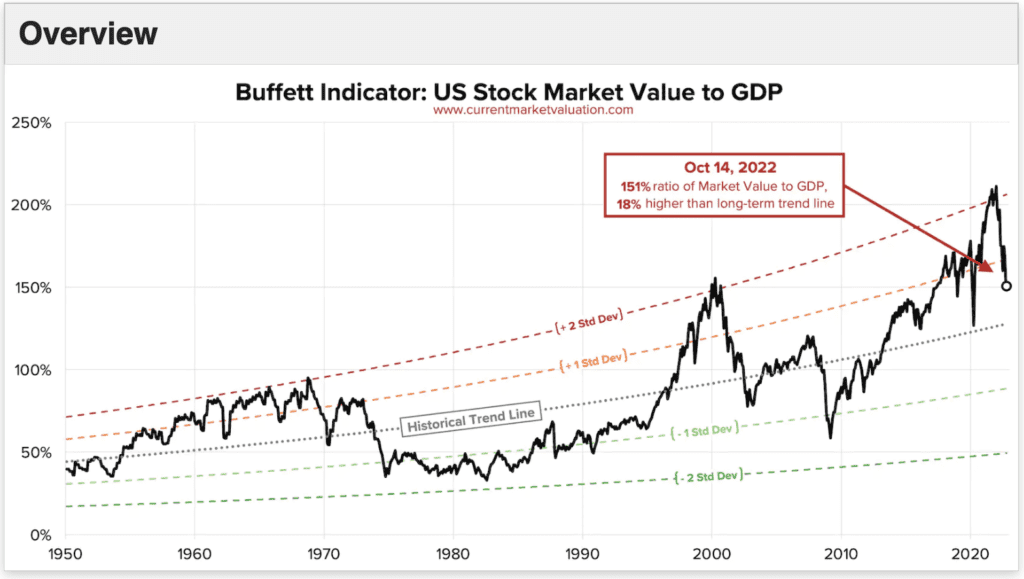
You must be thinking, despite all the drop we are experiencing right now, the market is still so overvalued??!
Does it mean that the market will drop even more? When can you start investing?
The truth is, nobody can time the bottom, not even the Buffett Indicator.
Before coming to the conclusion that 151% is expensive, let’s look at some more data points.
If you observe the chart closely, the Buffet indicator has not been below 100% since 2013. Even in March 2020 the covid crash, when the market experienced a rapid drop, the Buffett indicator was still slightly above 100%.
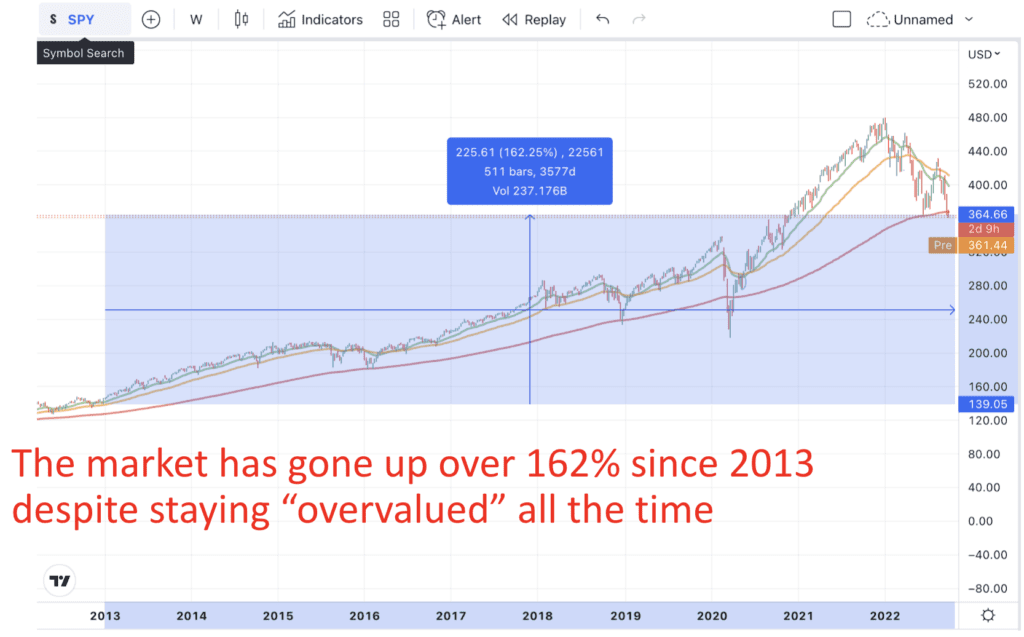
And if you stop investing because the Buffett indicator is above 100%, you would have missed out on over 162% of gain in the past 10 years.
Why Has The Buffett Indicator Remained High?
No indicator is perfect and there is certain criticism of the Buffett indicator. If you understand the counterarguments against this indicator, you will be able to make better investment decisions.
- It does not consider how stocks are valued relative to alternative investment vehicles, such as bonds
Generally, when interest rates are high, bonds pay a high return to investors, which lowers the demand (and prices) of stocks. Vice versa, when the interest rate is low, bonds pay less to investors, which lowers the demand for them, and thus raises demand for investing in stocks.
Over the last 50 years, the interest rate has an averaged 6%. During the .com bubble, equity investors had other good options for their money – but they still piled recklessly into stocks. And that’s what caused the drop back in 2000.
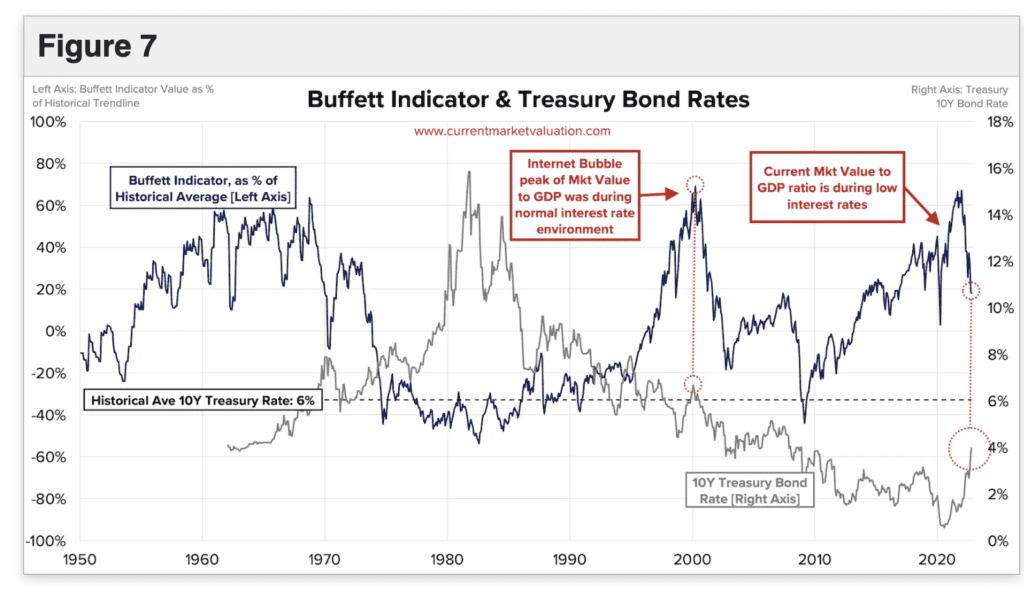
Whereas today, investing in bonds returns relatively little. Despite the interest rate hike, the 10-year treasury yield is still less than 4%. Today’s investors need to seek a return from somewhere, and low-interest rates are forcing them to seek that return from riskier assets, effectively pumping up the stock market. And that could be the reason why the stock market has been staying abnormally high due to the low-interest rate environment.
2. The stock market valuation reflects international activity while GDP does not
Though GDP does include national exports, it would not include something like the sales Apple makes in China. However, Apple’s China business is certainly priced into its overall stock price, which is listed in the US. This would therefore drive a higher Buffett Indicator value since the numerator (total stock market value) is going up, while the denominator (GDP) is unaffected.
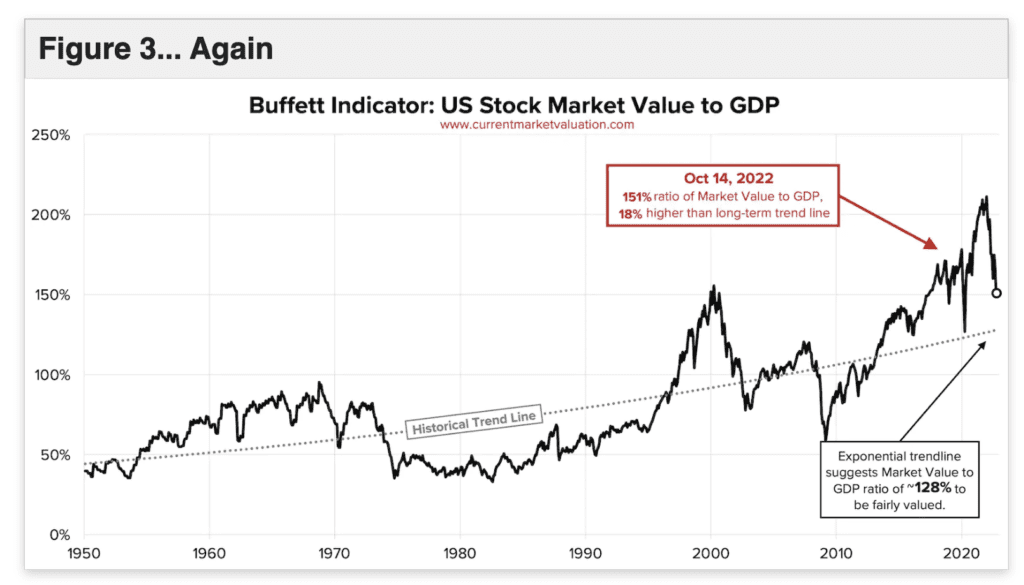
As globalization has expanded steadily over the last 50 years, this should be a key driver in the growth of the indicator over time. That is why over the years, the percentage benchmark for the Buffett indicator has also shifted up to price in the changes. And today, 151% can be considered fairly valued. For more information on the Buffett Indicator, you can read here.
Buffett Indicator Conclusion
In my opinion, many great companies have dropped to a pretty decent value. Instead of trying to constantly time the market bottom, which nobody can do, why not start investing and buying bit by bit, when the market is already pretty cheap? And if the market does go down lower, and reaches below 100% according to the indicator, buy more, just like Warren Buffett has been doing in every financial crisis to grow his wealth!
As this website is all about sharing what options trading strategies really work, if you are still afraid of the market dropping further, you can also consider using options to buy options insurance and protect your portfolio. This strategy will help you to profit and protect your portfolio even when the market drops. I don’t have time to go through this options strategy in this video, but you can join our upcoming Next Level Options Masterclass to learn about it!

If you want to set up a brokerage account to start your stock and options investing journey, you can consider MooMoo. You will even get a free share such as Amazon when you fund your account with $2700 SGD, and I will also send you my private portfolio watchlist to your inbox!
Do also note that this post is for educational purposes. The stock shared here is not a buy/sell recommendation. Please make sure you do your due diligence before making any investment decision, so you can become an independent investor! Lastly, if you want to stay up-to-date with my investment updates, do follow me on my telegram channel, where I share my daily investment insights!
I also made a video to share with you the Buffett Indicator step-by-step. Enjoy your learning!